
Many internationals in Finland would like to continue their further education to enhance their job opportunities and integrate better into…
Kirjoittajat
Sustainable Solutions: Infiltration Data Collection in a Multi-Use Park for Advanced Computational Stormwater Modelling
The infiltration rate is a fundamental parameter in hydrology and soil science. It measures the velocity at which water infiltrates the soil surface and moves through its network of pores. Estimation of this parameter is crucial for example in designing efficient stormwater management systems. The Water and Environmental Engineering research group used a mini disc infiltrometer to measure infiltration rates at 11 sites in Kupittaa Park during 2023. The results showed significant differences.
Kupittaa park is a large and multifunctional park that hosts a wide range of leisure activities, including volleyball, football, Finnish baseball, skating, boules, and dog walking (figure 1). It also has a swimming area, a mini zoo, a football stadium, and a café. As you might imagine from this description, this park has a wide variety of surface types, each of which has a unique impact on stormwater management.
The Finnish Meteorological Institute has produced future climate scenarios for Finland, based on current climate change projections included in the Fifth IPCC Assessment Report. In the period 2070-2099, precipitation in Finland is expected to increase by 8-20 per cent from 2022 levels. This significant increase will have a dramatic effect on stormwater management and underscores the urgent need for decision-makers to prioritize sustainable and effective stormwater management in urban design. One positive change would be to increase the proportion of permeable surfaces and to support water storage in nature-based solutions such as bioretention swales or other vegetated areas. Urban parks, such as Kupittaa park offer fantastic opportunities for these kinds of interventions.

Figure 1 Aerial view of Kupittaa park in the City of Turku (source: City of Turku).
Turku UAS is fortunate to be situated right next to this multifunctional park. This proximity also made Kupittaa park a very convenient test site for the Water and Environmental Engineering research group to try out its new infiltrometer. An infiltrometer is a tool used in hydrology and soil science to measure the rate at which water infiltrates the soil. The used infiltrometer is a version of this tool which is small enough to be carried in one hand and operated by a single researcher.
The infiltration rate, represented by the symbol k, is a fundamental parameter in hydrology and soil science. It measures the velocity at which water infiltrates the soil surface and moves through its network of pores. Soil type, moisture content, structure, vegetation cover, and terrain slope all impact infiltration rates. Accurate estimation of this parameter is crucial for flood prediction, groundwater recharge assessment, and designing efficient stormwater management systems. Insights into infiltration dynamics inform practical interventions for sustainable land use and water resource management and advance scientific knowledge of soil-water relationships.
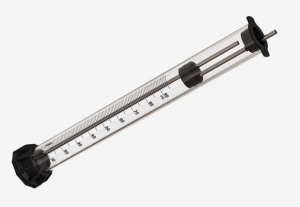
igure 2: Mini Disc Infiltrometer (source: Meter Group).
The motivation for testing water infiltration rates around Kupittaa park was to support the Intelligent and Sustainable Stormwater Management (ISMO) project. This project aims to establish a stormwater centre of expertise to develop better computational models, monitoring data and solutions for natural stormwater management. An essential step towards this goal is gathering data to support the development of advanced computational models, which we wanted to achieve in Kupittaa park. Infiltration rate measurements can be used to calibrate and validate the modelled results of water infiltration, which is essential for achieving accurate model results.
We selected 11 monitoring locations around the park, as shown in Figure 3, that represent a diverse range of surface types found in the park. Surface types included, among others, a stony car park, a Finnish baseball field, a bioretention swale, and a rubber crumb football pitch. The next step was to take soil samples from each location (Figure 4), with the exception of the artificial surfaces, and conduct a grain size analysis of each sample with the help of our colleagues in the Civil Engineering laboratory.
Grain size analyses were done in order to be able to link the measured infiltration rates to soil structure and ensure that site specific infiltration rate measurements can be extrapolated in a valid way to areas in the park where no measurements have been made. Finally, we sent samples from all but the artificial surfaces to an external lab for organic content analysis. This analysis would help us to understand the proportion of organic content, such as grass, roots or decomposing leaves, to mineral content.
We used the mini disc infiltrometer to measure infiltration rates at all 11 sites every week from July to October 2023. Much of the monitoring work was carried out by student assistants and trainees, who continue to play a vital role in collecting raw data across a huge variety of Turku UAS projects.
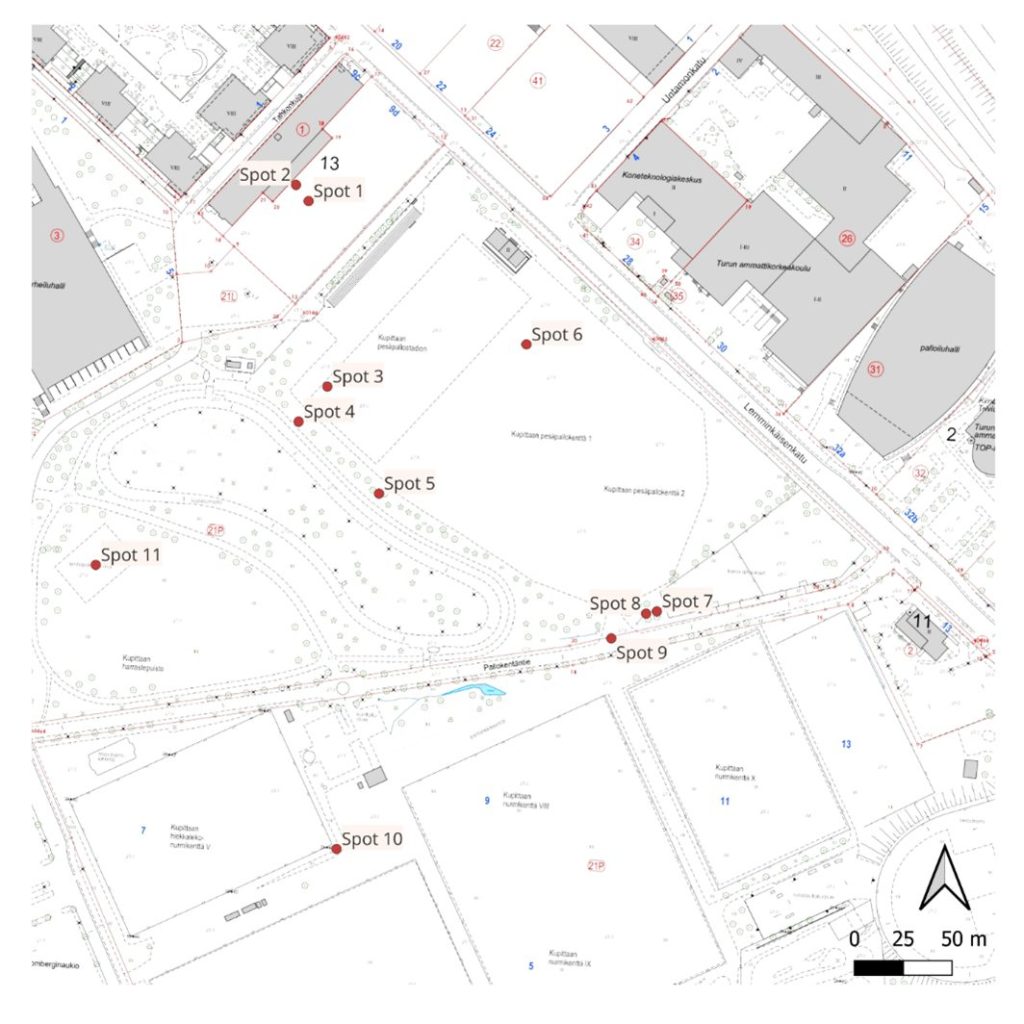
Figure 3 Map of infiltration sites (created by Anna Hupponen, student assistant).
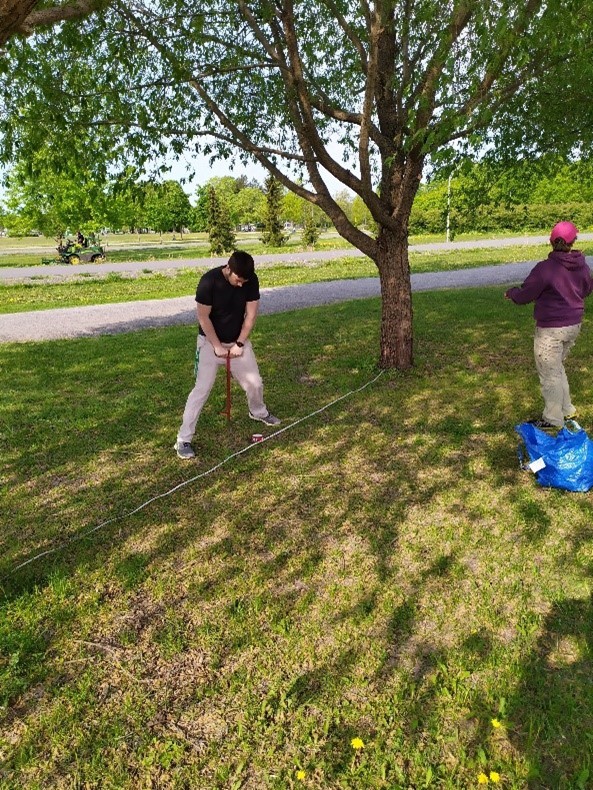
Figure 4 Taking soil samples with a koira for grain size analysis (source: WEE research group).
Figure 5 shows the mean infiltration rates (the “k-value”) throughout our monitoring period. Early analysis of our data suggests that different surface types had varying infiltration rates and that the context of the monitoring location also had an impact on the results. Sites 4 and 5, for example, are grassy lawns within twenty meters of one another, yet site 5 has an infiltration rate 59 per cent higher than site 4. The main difference between these two sites is that site 5 was situated below a tree’s canopy, whereas site 4 was in an open and unshaded area.
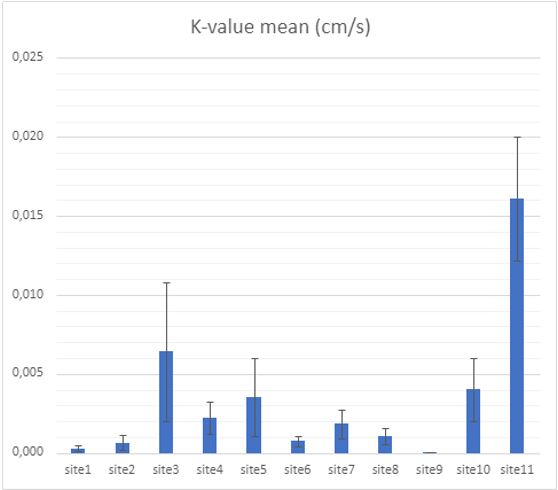
Figure 4. Mean infiltration rates for all surface types. Measurements taken from July to October 2023. Site Description 1 Car park 2 Car park 3 Finnish baseball pitch 4 Lawn, open 5 Lawn, under tree 6 Path, sand/gravel 7 Bioswale 8 Bioswale 9 Asphalt 10 Rubber crumb football pitch 11 Volleyball court, sand
We can broadly group our sites into four sets based on their infiltration rates (K-values). Sites 1,2, and 9 form a group of low K values; sites 6,7, and 8 are low intermediate; sites 3, 4, 5 and 10 are high intermediate; and site 11 stands alone with a high K value. The “low” group are all surfaces intended for heavy vehicles and high footfall. The grain size analysis for sites 1 and 2, both in this “low” set, revealed a predominance of sand with a large amount of gravel. These sites also had very low levels of organic content. In contrast, sites 4 and 5, both in the “high intermediate” group, were in areas not intended for heavy vehicles or high footfall and had the highest levels of organic content.
Our colleagues in the Computational Engineering (COMEA) research group will use the infiltration data gathered through this process to help develop a numerical simulation model of the park. The development of this type of model is a core objective of the ISMO project. It will help us to develop a deeper understanding of the physical mechanisms, causal effects and performance of different stormwater solutions and analyses of local scale surface flow and infiltration processes in order to produce information for city planners to be able to better prepared for future stormwater management issues in a changing climate. Integrating in-situ monitoring, such as that described in this article, with computational models will allow us to produce robust conclusions that decision-makers such as City of Turku can turn into action.
Sources
Finnish Meteorological Institute. Weather and Climate Change Impact Research. Finnish Meteorological Society. https://en.ilmatieteenlaitos.fi/weather-and-climate-change-impact-research web search /cited on 22nd April 2024.
IPCC, 2023: Climate Change 2023: Synthesis Report. Contribution of Working Groups I, II and III to the Sixth Assessment Report of the Intergovernmental Panel on Climate Change [Core Writing Team, H. Lee and J. Romero (eds.)]. IPCC, Geneva, Switzerland, pp. 35-115, doi: 10.59327/IPCC/AR6-9789291691647.