


Valtion rahoitus korkeakouluille pienentyy, ja kilpailu kansallisesta ja kansainvälisestä TKI-rahoituksesta tiukentuu. Tässä kilpailussa pärjätäkseen on kyettävä synnyttämään ja osoittamaan vaikuttavuutta….
Tekijät | Authors

Achieving More Value in Customer-Supplier-Relation by Combining Buying and Selling Methods
This article proposes companies, who are willing to cooperate with each other in a supplier–customer relation, to use the synergy of several methods: Value Management and the combination of Kano’s method with Quality Function Deployment, known as Customer Satisfaction and Quality Function Deployment (CSQFD). The first part of this article gives an introduction to Value Management (VM), Value Analysis (VA) and Value Engineering (VE). The second section is dedicated to the combined process of CSQFD. In the final part of this article, the common parts of both methods are identified and a combined approach is shown.
1 Introduction
While purchasing departments are looking for low costs, selling departments are aiming for high margins. When it comes to technical goods in Business-to-Business relations (B2B), an increasing number of companies shift their targets from theses financial goals to a wider viewpoint. Internal or external suppliers are asked to increase the value of the goods. Companies focusing on goods’ value handle this Value Management (VM). On the other hand, internal departments providing goods to other departments or many supplying companies use the Kano method to understand what the customer wants and / or use the process of Quality Function Deployment (QFD) to identify which function needs more attention in the developing or producing process to meet customers’ expectations. Still, only in few supplier–customer relations, both these methods are combined [1].
While purchasing departments are looking for low costs, selling departments are aiming for high margins. When it comes to technical goods in Business-to-Business relations (B2B), an increasing number of companies shift their targets from theses financial goals to a wider viewpoint.
2 Value Management, Value Analysis and Value Engineering
Historical Background
Value Management is a management style which is especially good to mobilize people, to develop competences as well as support synergy and innovation with the target to maximize the total power of an organization [2]. VM can also be described as an organized function-oriented systematic team approach. Its main principle is to analyze the functions and costs of a product. The purpose of VM is to increase the value of a product or good by increasing the function and/or reducing the cost of the product. [3, 4].
Lawrence D. Miles first started to develop methods of VM in 1943 [5, 6]. At his company General Electric, Miles mainly focused on exchanging material and reducing the cost of products without changing the product’s functional performance. Many institutions and authors further developed VA and VE [5, 7]. Especially the German Society of Engineers, VDI, developed a comprehensive process of VA [8].
The purpose of Value Management is to increase the value of a product or good by increasing the function and/or reducing the cost of the product.
The Value Management Method
A product is a technical machine, a service or even software. Within VM, VA is performed on existing parts whereas VE is used in new product design. The target of VM is to increase value. The value of products is expressed by the ratio of the fulfilment of customer’s needs and the cost induced by the use of the resources to make the product.
![]()
The symbol ∝ is used to express that this is no equation but just showing a relation [9]. Resources can be services, material and other costs needed to generate a part. Needs are customer needs but also user’s wishes. Increasing value can be done by either a higher grade of fulfilment of needs and / or decreased use of resources (see Figure 1). Both tools, VA and VM, analyze the functions and costs of the all product parts.
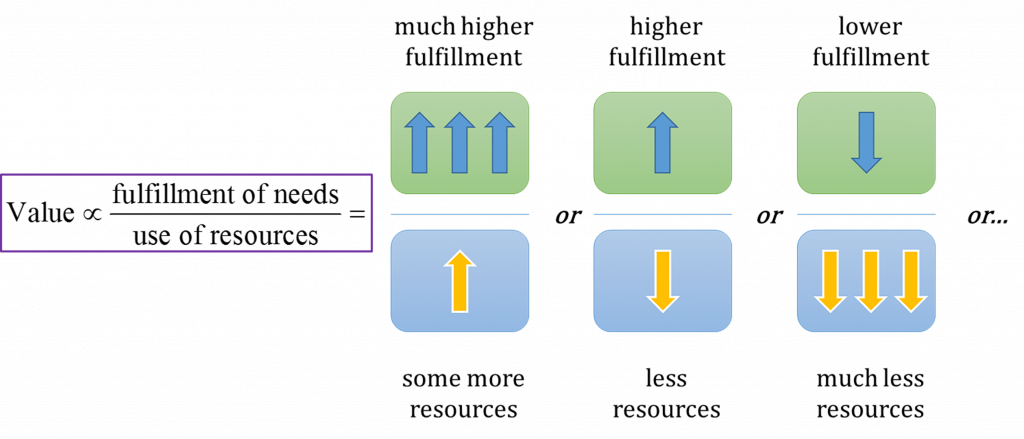
Figure 1 Examples of value increase by mean of changed cost and / or fulfilment of needs (after [8], own sketch).
Value Management Explained
Many purchasing departments do decrease cost only by using the ABC analysis. This approach is likely to fail as the cost reductions often come together with a decrease in quality or in function. Thus, the value and the functions must be investigated at the same time.
A function is the effect of a product {or system} or of its parts {sub-systems} on something. In VM the function can be defined by answering two questions: “How to do something?” and “Why using something?” For a LED display, these questions and answers can be as follows:
- “How to display information?” The answer is: “By using a LED display”
- “Why use a LED display?” The answer is “To display information”
This sequence can be continued to break down the product under investigation into the sub-systems and elements. Finally, all function carriers needed to manufacture the product will be listed and connected to all of their functions. A function carrier (FC) may fulfil several functions. Each FC will be ranked depending on its importance. The three major ranks are Basic Functions (B) having all the fundamental major functions, Auxiliary Functions (Aux) supporting or enabling B-functions and Additional Functions (A) interacting with the environment (super-system) of the product. A table is created with the weighted function index F for each function carrier and the related weighted costs. In the calculation process, B-functions will get the highest functional points. The Aux- and A-functions will be enumerated from highest importance (index 1) to lowest (index n). Their numerical quantitative values will be n for functions having index 1, counting downwards to 1 for the least significant An or Auxn,. B-functions’ numerical quantitative value will be n+2. An example of this calculation is given in Table 1 for a torch light. The weighted index F and the weighted costs C are based on a maximum weight of 10. F divided by C yields the value V. The power map of the product is sketched using C and F (Figure 2). From the power map, one can derive actions to increase the product value.
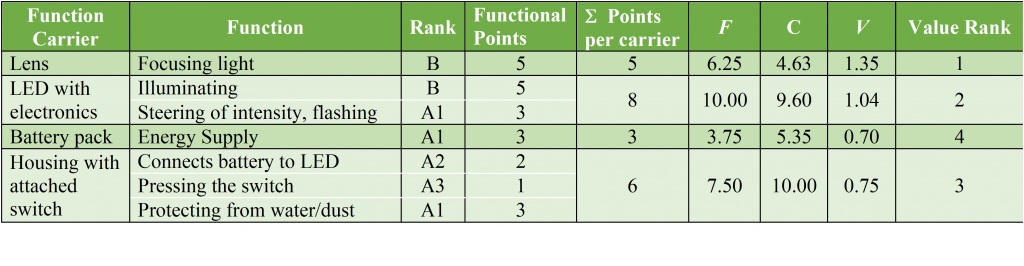
Table 1 Example matrix of a Value Analysis of a product (torch light).
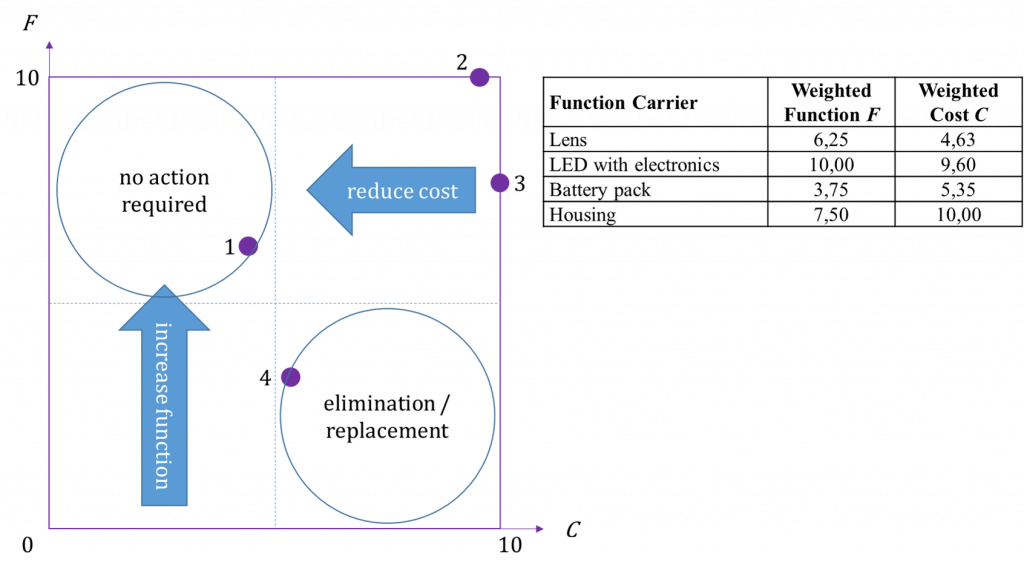
Figure 2 Power map of the example torch light.
The power map shows F and C of each function carrier. If a function carrier has high value, it will be found in the upper left square. There, the priority of reducing cost or increasing value is lowest. Function carriers found in the lower right square have low value and corrective actions are required. The power map reveals also strength and weaknesses of the VA and VE. A list of these is found in the literature, e.g. in Fischer’s book on cost minded construction [10]. One strength of the value analysis is, that it is focussed on functions, which are wanted by the customer. Therefore, it is a customer-oriented method. This is the base of combining VM with CSQFD.
3 Customer Satisfaction and Quality Function Deployment (CSQFD)
As listed above, Value Management is customer oriented and uses methods like the one of Kano or the Quality Function Deployment (QFD). Both methods are widely described in the literature and well established [Literature on Kano e.g. [11–13]; QFD e.g. here [14–18]. In [19], but also in [20–22] and further literature, the combination of both methods has been described.
CSQFD Explained
The fundamental base of this method is the House of Quality (HoQ) as part of the QFD and Kano’s model of customer satisfaction (CS). Kano’s method is asking for the degree of fulfilment of a technical feature from the customer’s viewpoint. Mainly, there are attractive (A), one-dimensional (O), must-be (M), reverse and indifferent attributes. By asking pairs of functional and dysfunctional questions, the customer selects from five potential answers. The customer can be (very much) delighted, indifferent or (very much) distracted by the presence or absence of a product feature. This provides a grade of importance for each feature. Therefore, CS is correlating a customer’s desire and the fact how much she is pleased by the degree of fulfilment.
The HoQ is the matrix of customer requirements and the technical realization by detailed specifications. The indexed importance of each requirement is the input from the customer. For each specification, this index is multiplied with the degree of fulfilment by the selected specification item. It ends up in a weighted priority for the further development of the product. This part of the QFD correlates customer expectations on features to dedicated specifications.
Looking solely at the results from the CS process, it is clear that there is no link to the specification requirements or that it has any influence on the preference for development. QFD is not made to take the customer’s satisfaction or dissatisfaction into account. However, both use weighted numbers to express this.
In [19] it is described, how to merge CS and QFD to CSQFD. This powerful method is used for taking the outcome of CS as additional weight to the calculation of the priority for each specification. The picture for the development of the product changes and the customer will be much more satisfied with the single features of the product.
An example is shown Table 2. In this case, QFD only shows similar development preferences for the lens and the type of LED; the housing material and the electronics respectively. After the CS inclusion, the indication of which specification equipment to focus most on is much more clear, here it is the type of the LED which should receive the largest share in development.
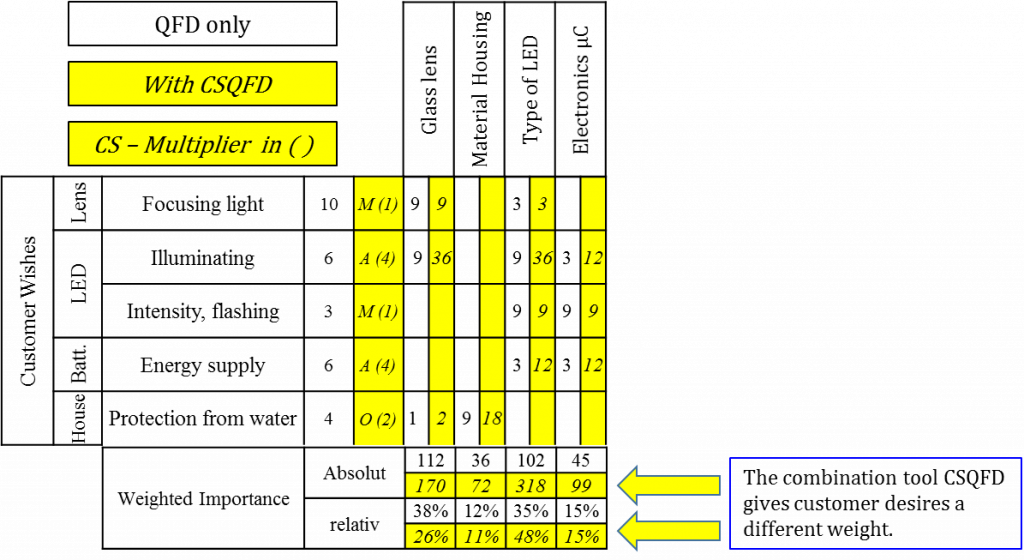
Table 2 The HoQ compared for QFD and CSQFD approach. Calculation after [20].
4 Combining both worlds: Value Management and CSQFD
Before being able to combine these methods, the following must be clear: Value Management is a method driven by a manufacturer with the target to get best value from internal and external suppliers. CSQFD is a method driven by a company selling products to a customer. To link both tools, the manufacturer in the VM world must be customer of the supplier in the CSQFD world. Both companies must be willing to optimize the value of the final product with respect to customer satisfaction in Kano’s way of thinking. Non-cooperative customer-supplier relations as found e.g. in many automotive supply chains will not be able to increase a products value with VM and CSQFD.
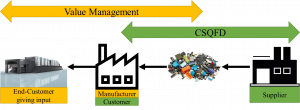
Figure 3 Value Management and CSQFD: The end-customer of the manufacturer is providing the user’s input for VM; Kano model and the HoQ.
As shown in figure 3, the manufacturer must forward information to the supplier, who is steering the CSQFD process. This can be initiated by the seller of the supplier and supported by three-sided non-disclosure-agreements, when required. The similarities and differences of both methods are given in Table 3. Analytically, the easiest approach would be to multiply the weighted importance of the parts found in the HoQ of the CSQFD with the computed values of the value analysis. In Table 4, the results are shown. In addition, a new rank of importance has been added to the diagram. It shows that the LED now becomes most important. In the given example, it is due to the customer’s satisfaction with high illumination and the option of flashing. Both the end-customer’s and the user’s needs are better expressed. The final product will be more satisfying to the end-customer and at the same time, the value of the subsystems are optimized.
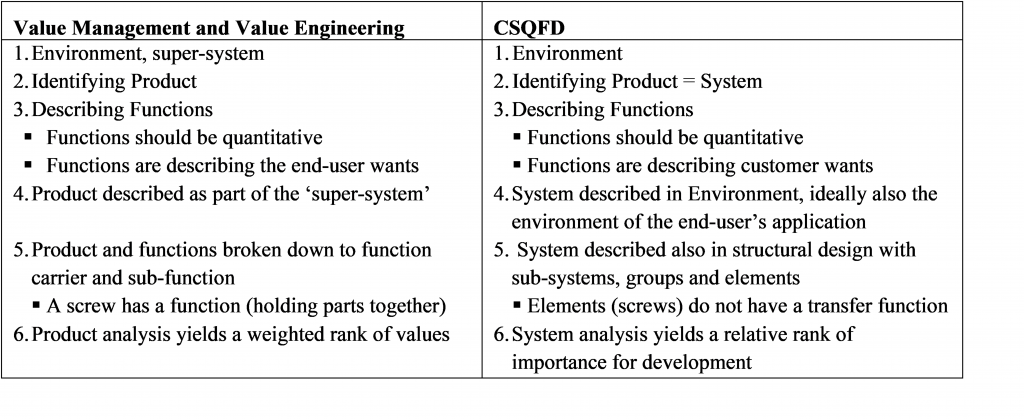
Table 3 Comparison of Value Management and CSQFD terms
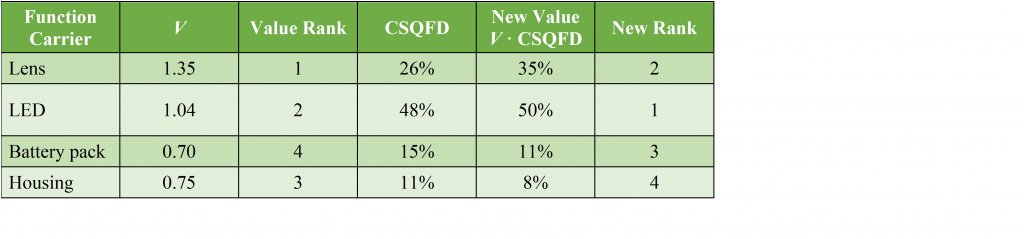
Table 4 The final result after combining the CSQFD with the value management
5 Conclusion and outlook
Value management and CSQFD have many tools in common. The analytical method of describing a product by the functions of its parts and sub-system is with a few exceptions identical in both models. Customer expectations found in VM and CSQFD can be used as a link to combine them. The degree of customer satisfaction must be also be ‘valued’, which can be done using Kano’s method of disjunctive pairs of questions and calculation of a new, relative value. The outcome may change the rank of the function carriers with the benefit that the customer is more in focus.
In future works, a case study accompanied by a more detailed mathematical method for value calculation should help to deepen the understanding of the new method on the one side. On the other side, more research is needed to settle the new method into a broader process, which still has to be straightforward and focused.
References
- Pfister W (2011) Praxisbeispiele. In: VDI (ed) Wertanalyse – das Tool im Value Management, 6th edn. Springer, Heidelberg [u.a.], 157–262
- Deutsches Institut für Normung e. V. (2002) Value Management: Deutsche Fassung EN (12973 2000)
- Qiping Shen G, Yu ATW (2012) Value management: recent developments and way forward. Construction Innovation 12(3): 264–271. doi: 10.1108/14714171211244631
- Shen QP (1993) A knowledge-based structure for implementing value management in the design of office buildings: PhD Thesis. Document Supply Centre. British Library, Salford
- Jay CI, Bowen PA (2015) Value management and innovation: A historical perspective and review of the evidence. J of Eng, Design and Tech 13(1): 123–143. doi: 10.1108/JEDT-03-2013-0021
- Marchthaler J, Wigger T, Lohe R (2011) Value Management und Wertanalyse. In: VDI (ed) Wertanalyse – das Tool im Value Management, 6th edn. Springer, Heidelberg [u.a.], 11–38
- Bronner A, Herr S (2006) Vereinfachte Wertanalyse: Mit formularen und CD-ROM. VDI-Buch. Springer, Heidelberg
- VDI (ed) (2011) Wertanalyse – das Tool im Value Management, 6th edn. Springer, Heidelberg [u.a.]
- DIN (2000) Value Management: German Version (EN 12973)
- Fischer JO (2008) Kostenbewusstes Konstruieren: Praxisbewährte Methoden und Informationssysteme für den Konstruktionsprozess. Springer, Berlin
- Kano N (1984) Attractive Quality and Must-be Quality. The Journal of the Japanese Society for Quality Control 14(2): 39–48
- Matzler K, Hinterhuber HH, Bailom F et al. (1996) How to delight your customers. Journal of Product & Brand Management 5(2): 6–18
- Sauerwein E, Bailom F, Matzler K et al. (1996) The Kano Model: How to Delight your Customers. Preprints Volume I of the IX. International Working Seminar on Production Economics (I): 313–327
- Akao Y (1972) New Product Development and Quality Assurance – Quality Deployment System. Standardization and Quality Control 25(4): 7–14
- Akao Y, Mazur GH (2003) The leading edge in QFD: past, present and future. International Journal of Quality & Reliability Management 20(1): 20–35
- Herzwurm G QFD-ID: Einführung in QFD. http://www.qfd-id.de/wasistqfd/qfd_einfuhrung.html
- Saatweber J (1997) Kundenorientierung durch Quality Function Deployment: Systematisches Entwickeln von Produkten und Dienstleistungen. Hanser, München [u.a.]
- Wen HT, Tong J, Fan XM et al. (2010) Using QFD to analyse demand chain management in China for European winery. In: EM, pp 265–269
- Schneider-Störmann L (2015) Technische Produkte verkaufen mit System: Einführung und Praxis des technischen Vertriebs. Hanser, Carl, München
- Tan KC, Pawitra TA (2001) Integrating SERVQUAL and Kano’s model into QFD for service excellence development. Managing Service Quality 11(6): 418–430
- Tan KC, Shen XX (2000) Integrating Kano’s model in the planning matrix of quality function deployment. Total Quality Management 11(8): 1141–1151
- Tontini G (2007) Integrating the Kano Model and QFD for Designing New Products. Total Quality Management 18(6): 599–612
![]()